 American States Water
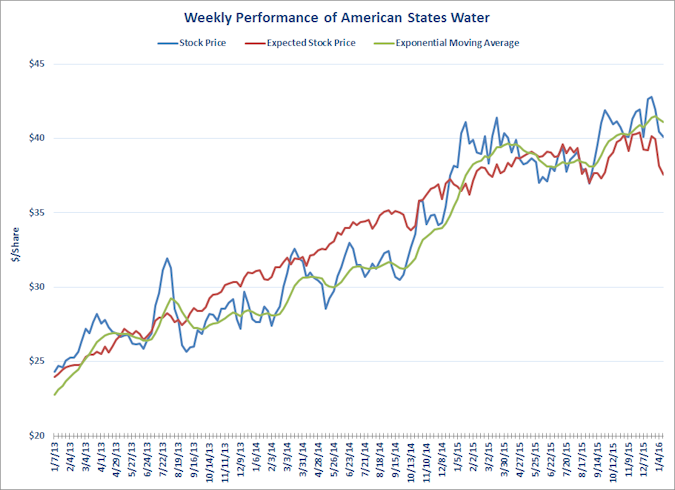
American States Water (AWR) stock price continues to increase on the public announcement of favorable price redeterminations and additional construction projects for its unregulated subsidiary, ASUS on military bases. The stock price now stands 6.9% above its expected price. AWR’s price has decreased by 2.4% over the past 52 weeks. The stock had previously enjoyed a brief period of an over-performing stock in early March 2014 when Zack’s issued a “strong buy” opinion on the company. The stock price stands at 3% below the 10-week exponential moving average.
AWR stock had been over-performing relative to the returns forecasted by the Capital Asset Pricing Model by an annual rate of 8.2% from January 2006 through December 2012. The company’s stock has performed strongly in 2013.
 American Water Works
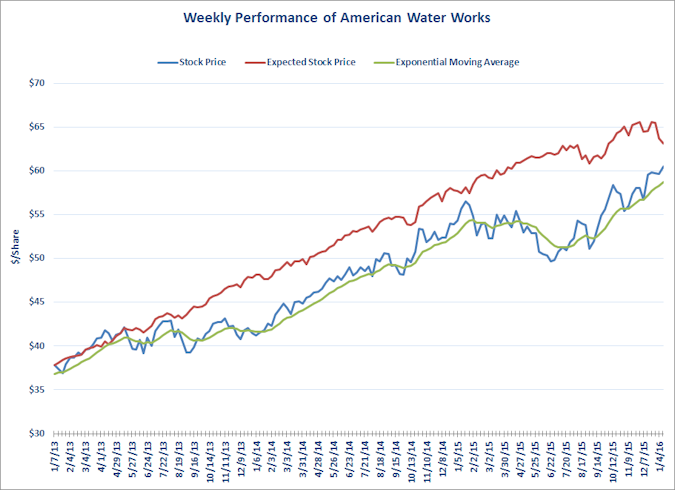
American Water Works (AWK) stock price has been increasing since early September on a wave of positive news including the granting of new water rates in New Jersey and a recent approval by the California Coastal Commission for a test slant well to test the feasibility of the technology for the company’s proposed desalination plant on the Monterey Peninsula. The recent price increases may signal a breakout from the lagging stock performance dating back to 2013 with announced decline in revenue from above average rainfall and cooler temperatures in its service areas.
Since then, the price has increased in tandem with its expected price, although at a lower level. AWK’s price has increased by 6.9% over the past 52 weeks but still stands 4.2% below its expected price. The stock price stands at 5% above its 10-week exponential moving average.
A public filing by BlackRock who now owns 10% of AWK bumped the price temporarily in January 2015. The turnaround in the price in June 2015 was driven by the acquisition of Keystone Clearwater Solutions, a freshwater pipeline producer who pumps and stores water for natural gas producers.
AWK stock had been over performing relative to the returns forecasted by the Capital Asset Pricing Model by an annual rate of 12.3% from January 2006 through December 2012. AWK’s stock price generally followed the expected price forecasted by the Capital Asset Pricing Model (adjusted for historical over performance) until late August 2013.
Cal Water Services
California Water Services (CWT) stock price continues its sharp rebound from earlier price declines based on concerns that the mandatory water conservation due to California’s drought will reduce the company’s earnings prospects. The price now stands 2.7% below its expected price. CWT’s price has declined by 10.7% over the past 52 weeks. The price stands 1% ahead of its 10-week exponential moving average. The stock price had been on a declining trend since March 2015.
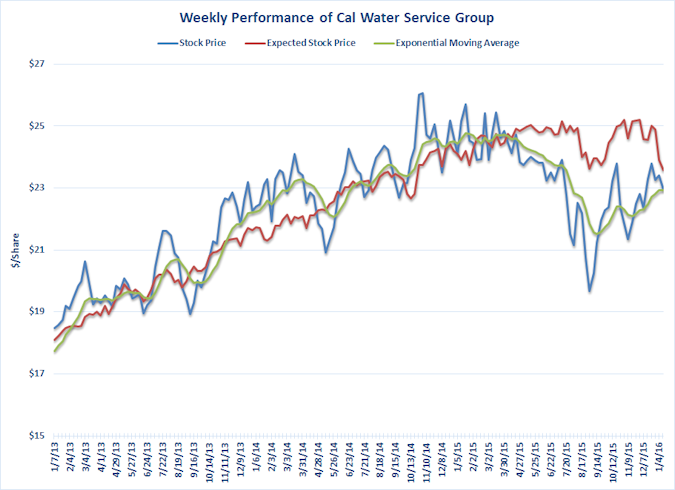
CWT stock has been over performing relative to the returns forecasted by the Capital Asset Pricing Model by an annual rate of 2.4% from January 2006 through December 2012. Cal Water’s stock price generally followed the expected price forecasted by the Capital Asset Pricing Model (adjusted for historical over performance) in 2013 until mid-October. The increased pricing followed the announcement of a settlement of the company’s general rate case with the California Public Utilities Commission Office of Ratepayer Advocates.
 San Jose Water
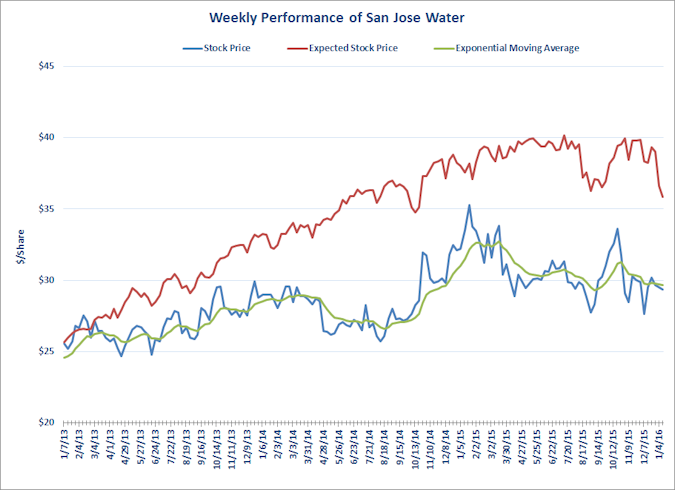
San Jose Water (SJW) stock price struggles continue. The price is 18.0% below its expected price reflecting significant price deterioration in 2015, although the price turned in October (as has prices for other California water utilities). The recent price jump is in response to a long awaited California PUC decision on the company’s 2013 rate case, which proved temporary. SJW’s price has fallen by 6.3% over the past 52 weeks. The stock price has declined by 16.7% over the past 52 weeks and stands 1% below its 10-week exponential moving average.
SJW stock has been over performing relative to the returns forecasted by the Capital Asset Pricing Model by an annual rate of 2.8% from January 2006 through December 2012. San Jose’s stock price performance has generally lagged behind the price forecasted by the Capital Asset Pricing Model (adjusted by historical over performance) for most of 2013 until December 2014. The company announced the appointment of a new Chief Administrative Officer on January 30, 2014.
You must be logged in to post a comment.