Water providers throughout the West find themselves between a trend and a hard spot: (i) increased emphasis on water conservation and variable water demands, versus (ii) financial solvency. The conflict arises because the delivery of water requires extensive investment in infrastructure (storage, wells, pipelines, canals, treatment and distribution). Normally, these infrastructure costs are fixed in the sense that they do not vary with the volume of water delivered. Further, with water conservation and other reasons for reduced water demands on the horizon, the infrastructure once sized for a future of increasing water demands may become overbuilt from the perspective of a “new normal” of lower water demands.
The interplay of these forces generates the current public discourse over water conservation and water rates. When drought occurs and people cutback on water use, water rates increase. So, what is the incentive for customers to conserve water if their water rates increase?
A meaningful public discourse needs a sound conceptual framework. Below, I use the circumstance of the Metropolitan Water District of Southern California (“MWD”) to illustrate the challenges. I then present a simple economic model of water rate setting and analyze the consequences of cutbacks in water use (as in drought) and water conservation. I show that an individual’s economic incentive for water conservation falls significantly as conservation efforts become more widespread.
The economic problem is that water rates are driven by the concept of cost recovery and cost recovery is driven by infrastructure costs and very little by the economic value of water. In a subsequent JOW Corner piece, I will show how a new approach to water rate structure can install meaningful economic incentives for water conservation while meeting the goals of traditional cost recovery and protecting a water provider’s solvency.
Illustration of the Challenge
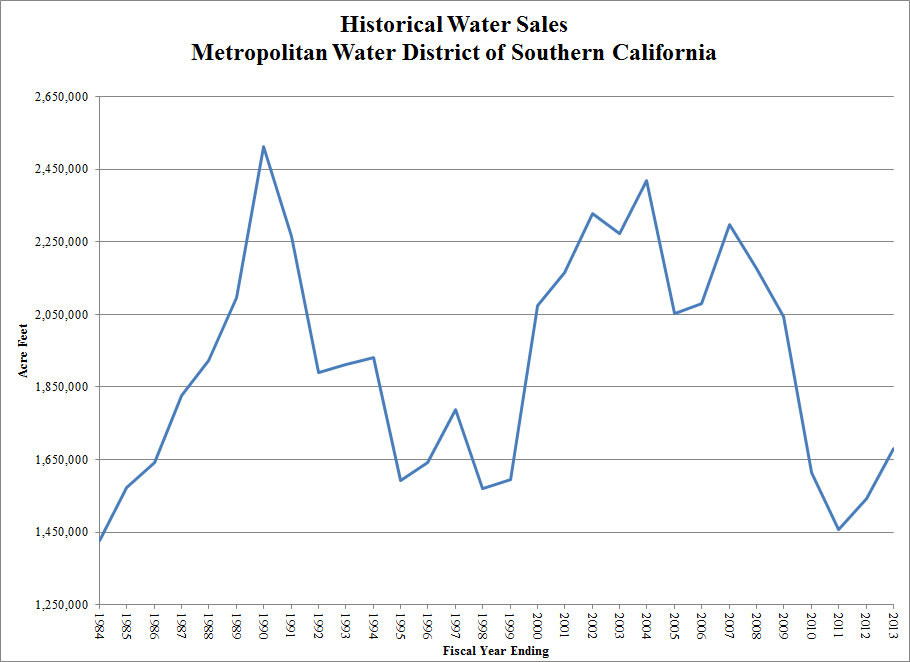
MWD exemplifies the challenges of variability in water sales (see chart for last 30-years of water sales). MWD’s water sales rapidly expanded in the 1980s, increasing from 1.4 million AF in 1984 to an all-time high of 2.5 million AF in 1990 (the year before California’s severe 1991 drought). Thereafter, water sales plummeted over the next nine years, reaching a low of about 1.6 million AF in 1999. Water sales began growing again, reaching about 2.4 million AF by 2004. Again, declines have set in. MWD water sales bottomed out at about 1.45 million AF in 2011 then recovered to 1.7 million AF by 2013.
Increased water conservation is on the horizon. The California Legislature passed AB 2020 requiring municipal water systems to reduce their per capita daily use by 20% by 2020. Governor Brown is further advocating increased water conservation in the face of the drought. With California’s high-tax, business unfriendly regulatory environment and water supply reliability challenges, will economic growth be rapid enough to increase water demands in the face of increased water conservation?
MWD’s cost structure is dominated by fixed costs (see table below). The cost-of-service study prepared for setting of MWD’s rates and charges classifies MWD’s costs as fixed demand, fixed commodity, fixed standby, variable commodity and hydroelectric. Variable commodity costs accounts for only 16.5% of total classified costs. Eighty-three and one-half percent of MWD’s costs are fixed.
MWD’s Service Function Revenue Requirements
(by Classification Category)
|
Fixed Demand |
Fixed Commodity |
Fixed Standby |
Variable Commodity |
Hydroelectric |
Total |
|
$133,894,761 |
$940,664,230 |
$188,727,763 |
$248,8882,824 |
($518,683) |
$1,511,650,894 |
Source: MWD Cost of Service, Fiscal Year 2014/2015, Option 1, p. 22 (Schedule 7) of Attachment 4 to Board Letter to Finance and Insurance Committee for April 8, 2014 MWD Board Meeting, Item 8-1
MWD’s rate structure includes water rates and fixed charges (Readiness-to-Serve Charge and the Capacity Charge—see table below). Revenues from water rates represent 86.6% of MWD’s Revenue Requirement (which equals the Revenue Requirement in the table on costs). The Revenue Requirement from fixed charges represents 13.4% of the total. With fixed costs 83.5% of MWD’s total revenue requirement and revenues from fixed charges only 13.4% of total Revenue Requirements, the remaining 70.1% of MWD fixed costs are included in water rates. Therefore, fixed costs account for 80.9% of the Revenue Requirement from water sales (80.9% = 70.1%/86.6%).
Classified Serve Function Revenue Requirements
(by Rate Design Element)
|
Item |
Water Rates |
Readiness-to-Serve |
Capacity Charge |
Total |
|
Amount |
$1,308,777,776 |
$158,847,703 |
$44,025,415 |
$1,511,650,894 |
|
Share |
86.6% |
10.5% |
2.9% |
Source: MWD Cost of Service, Fiscal Year 2014/2015, Option 1, p. 24 (Schedule 8) of Attachment 4 to Board Letter to Finance and Insurance Committee for April 8, 2014 MWD Board Meeting, Item 8-1
MWD’s rate structure is a classic example of water rates set to cover significant fixed costs as well as variable costs of water service. The rate structure assumes that MWD’s water sales will be 1.75 million AF in FY 2014/2015, of which 910,000 AF will be treated water sales. Sales below these levels mean that the rate structure will not generate sufficient revenues to cover fixed costs. Sales above these levels mean that the rate structure will generate revenues in excess of fixed costs. In the short term, MWD’s financial reserves are the cushion. It withdraws monies from reserves when sales are below forecasted levels to cover the shortfall in revenues relative to fixed costs. It adds to financial reserves when sales are above forecasted levels.
Financial reserves are limited. Therefore, if water sales fall reserves can only buffer the timing and magnitude of changes in water rates. So, the larger and more sustained the decline in water sales, the larger and more sustained the increase in water rates. Alternatively, the larger and more sustained the increase in water sales, the larger and more sustained the decrease in water rates until water sales require new investments in infrastructure and water supplies.
Simple Model of Water Rate Setting
Consider a residence whose annual water use is 0.5 AF/year, which is equivalent to 217.5 hundred cubic feet (“ccf”, a common measurement in retail rate structures). The current water rate is $3.00 per ccf. Assuming that this rate has a variable cost component 20% of the total and a fixed cost component 80% of the total, the retail water rate has the following variable cost and fixed cost components:
|
Variable Cost |
Fixed Cost |
Water Rate |
|
$0.60/ccf |
$2.40/ccf |
$3.00/ccf |
For an individual consumer whose use is minuscule relative to total sales, the water rate measures their cost of water. Therefore, the incentive for conservation is $3.00/ccf ($1,305/AF). Of this incentive, $0.60/ccf ($261/AF) represents a reduction in variable costs and $2.40/ccf ($1,044/AF) represents a reduction in the customer’s contribution to fixed costs. While the reduction in contribution to fixed costs grows with the degree of water conservation, the lost revenue from this individual customer is small (see table below).
Reduced Annual Contribution to Fixed Cost from Individual Water Conservation
| Amount Conserved |
10% |
20% |
30% |
40% |
| Reduced Payments to Fixed Cost |
$52.20 |
$104.4 |
$156.60 |
$208.80 |
While one individual can conserve water and have no material impact on water rates, this is not the case for a group of individuals (see table below). The case of the individual discussed above is the case of 0% customers conserving. Note that the water rate remains constant at $3.00/ccf independent of the amount conserved. Water rates increase with both the amount conserved and the share of customers conserving. This, of course, illustrates the public discourse about water conservation and water rates.
Water Rate by Amount Conserved by Individual and Share of Customers Conserving
($/ccf)
|
Customers |
Amount |
Conserved |
||
|
Conserving |
10% |
20% |
30% |
40% |
|
0% |
$3.000 |
$3.000 |
$3.000 |
$3.000 |
|
10% |
$3.024 |
$3.049 |
$3.074 |
$3.100 |
|
20% |
$3.049 |
$3.100 |
$3.153 |
$3.209 |
|
30% |
$3.074 |
$3.153 |
$3.237 |
$3.327 |
|
40% |
$3.100 |
$3.209 |
$3.327 |
$3.457 |
|
50% |
$3.126 |
$3.267 |
$3.424 |
$3.600 |
|
60% |
$3.153 |
$3.327 |
$3.527 |
$3.758 |
|
70% |
$3.181 |
$3.391 |
$3.638 |
$3.933 |
|
80% |
$3.209 |
$3.457 |
$3.758 |
$4.129 |
|
90% |
$3.237 |
$3.527 |
$3.888 |
$4.350 |
|
100% |
$3.267 |
$3.600 |
$4.029 |
$4.600 |
The economic incentive for water conservation declines with the share of customers conserving but increases with the amount conserved (see table below). The economic incentive is measured by the change in the individual’s water bill (taking into account both the reduction in water purchased and the increase in the water rate) divided by the amount of water conserved. The economic incentive declines with the number of customers conserving because water rates must increase to cover the reduced contribution to fixed costs from lower water sales. For a given share of customers conserving, the economic incentive for water conservation increases with the amount conserved. As long as not everyone is conserving, the non-conserving customers share in the increased water rates to offset the reduced contribution to fixed costs by conserving customers.
Economic Incentive for Water Conservation
by Amount Conserved by Individual and Share of Customers Conserving
($/ccf)
|
Customers |
Amount |
Conserved |
||
|
Conserving |
10% |
20% |
30% |
40% |
|
0% |
$3.000 |
$3.000 |
$3.000 |
$3.000 |
|
10% |
$2.782 |
$2.804 |
$2.827 |
$2.850 |
|
20% |
$2.559 |
$2.600 |
$2.643 |
$2.687 |
|
30% |
$2.332 |
$2.387 |
$2.446 |
$2.509 |
|
40% |
$2.100 |
$2.165 |
$2.236 |
$2.314 |
|
50% |
$1.863 |
$1.933 |
$2.012 |
$2.100 |
|
60% |
$1.621 |
$1.691 |
$1.771 |
$1.863 |
|
70% |
$1.374 |
$1.437 |
$1.511 |
$1.600 |
|
80% |
$1.122 |
$1.171 |
$1.232 |
$1.306 |
|
90% |
$0.864 |
$0.893 |
$0.929 |
$0.975 |
|
100% |
$0.600 |
$0.600 |
$0.600 |
$0.600 |
If everyone conserves, the economic incentive for water conservation equals the variable cost component of the water rate (see last row of above table). Here is the reason. The only cost savings for the water provider is the variable cost of water service; that is the variable cost component of the water rate. If everyone participates in water conservation, then everyone continues to pay a portion of the fixed cost of the water system based on their water use.
So, what is the incentive for customers to conserve water if their water rates increase? They avoid the variable cost component of the water rate plus shift a portion of their financial responsibility for the system’s fixed costs to non-conserving customers. As the conservation ethic becomes sufficiently widespread, the later gain becomes less significant. We are down to the variable cost component of water rates.
Generally speaking, the variable cost component of water rates involves the variable cost of infrastructure and delivery. Only in rare instances does a water rate include a charge for water. Therefore, the current economic incentive in water rate structures involves the variable cost of infrastructure and delivery and places no value on the water.
For example, MWD has a Priority 4 right to approximately 550,000 AF of Colorado River water (less their share of Indian Water Rights and Present Perfect Rights as specified in the Quantification Settlement Agreement). The cost basis for this water right is zero. Assuming that the annual value of Colorado River water with MWD’s priority is $500/AF, the annual value of Colorado River water used in MWD’s operations is $275 million. None of this economic value is in water rates. This is a predictable effect of public agency rate-setting based on the cost incurred rather than the economic value of water resources.
The same type of problem plagues regulated water utilities. When setting regulated water rates, public utility commissions will only consider the cost basis of water rights, not their economic value.
With water rates divorced from the economic value of water, why should we be surprised that the economic incentives for water conservation are not strong? There are economic incentives to conserve water under existing rate structures; they just have nothing to do with the economic value of water.
Written by Rodney T. Smith, Ph.D.
You must be logged in to post a comment.