There is an emerging consensus that the Lower Colorado River Basin is on the verge of declared shortages. There are indicators everywhere. Famous pictures of Lake Mead’s “bathtub ring” decry the plummeting amount of Colorado River water in storage. Record low natural Colorado River flows command our attention. The monthly Bureau of Reclamation “24-Month Study” paints a progressively deteriorating situation (see “Hydrologic Conditions: Colorado River Basin” in this issue). The Bureau’s future projections of the probabilities of shortages and surplus are catching the attention of Colorado River water users.
Well, it may be worse than you think. To understand why, one must “wade” into the Bureau’s method of forecasting the future condition of the Colorado River to understand why the risk of shortages in the Colorado River Basin may be greater than projected.
Bureau’s Methodology
The Bureau of Reclamation forecasts the future status of the Colorado River with the Colorado River Simulation System (“CRSS”). Simulations are available for 2015 through 2060. The future flows of the Colorado River are based on the 1906-2010 historic record of Colorado River flows using the “Index Sequential Method.” Under this method, there are a total of 105 runs where the flow for 2015 is assumed to start at one of the years in the 1906-2010 record and proceed for 46 years. If the end of the historic record is reached before 46 years, then the method uses the flows starting in 1906 and thereafter as needed to obtain flows for 46 years.
The Bureau of Reclamation provided Stratecon (JOW’s publisher) with spreadsheets that provided the year-by-year forecasts for Lower Basin shortages and surpluses for the 105 runs. The probability of a shortage in the Lower Colorado River Basin can be computed for each year by counting the number of runs for a year with a shortage divided by the total number of runs. The probability of surplus water can be computed each year by counting the number of runs for a year with a positive quantity of surplus water divided by the total number of runs. The probability of a normal year for each year can be computed by counting the number of runs for a year without a shortage or surplus divided by the total number of runs.
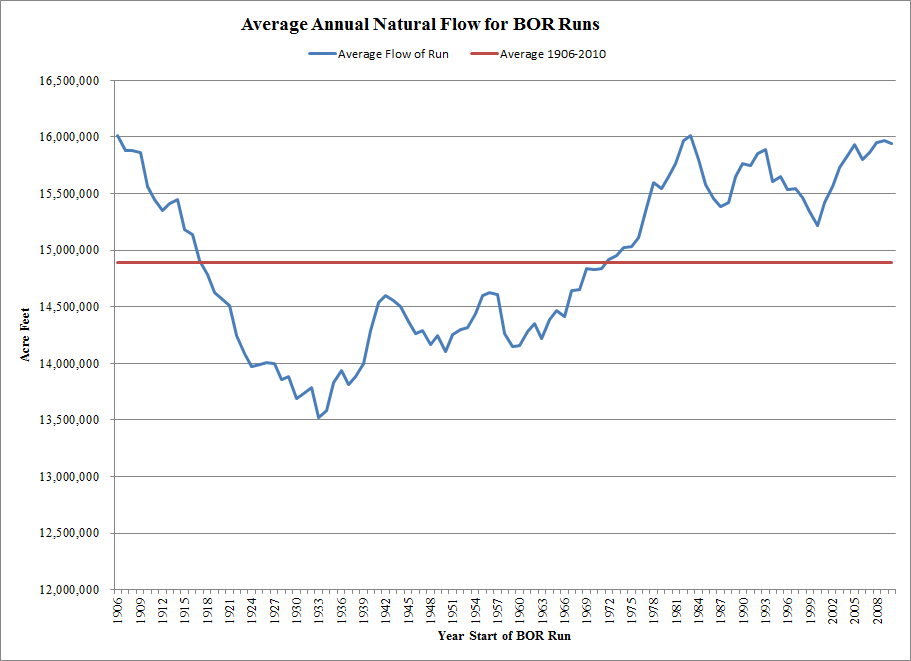
The chart below shows the average annual natural flow of the Colorado River at Lees Ferry for the Bureau of Reclamation runs starting in each of the years of the 1906-2010 historic record. The average flow for the 1906-2010 period is 14.9 million AF. Note that average flows for runs starting with the years 1906-1916 and 1974-2010 are in excess of 14.9 million AF. That is, in 48 of the Bureau’s 105 runs (or 46% of the runs), the Bureau is assuming that the average flows in the Colorado River between 2015 and 2060 will be greater than the average flows during the 1906-2010 historic record.
click to enlarge
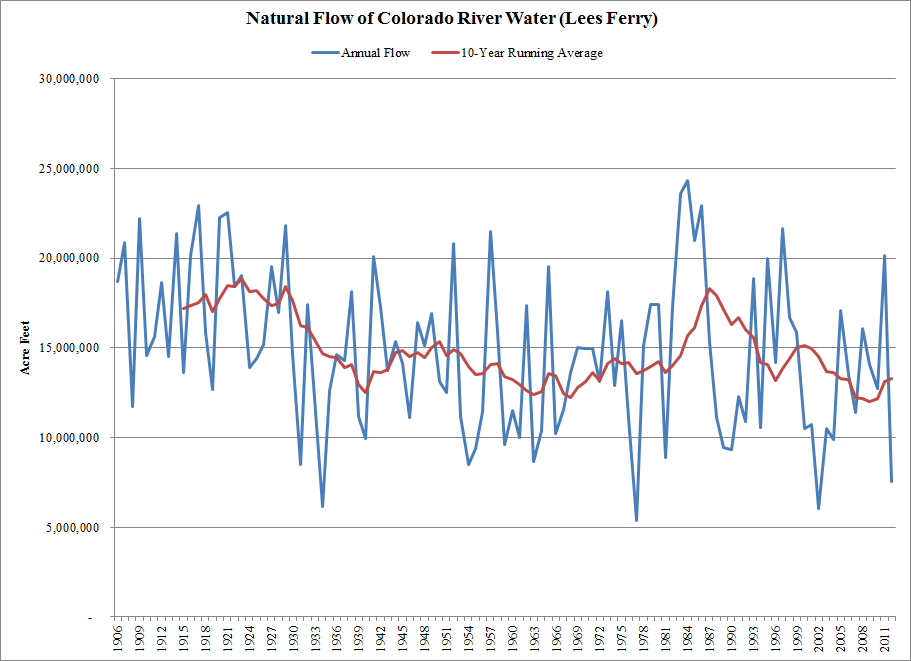
Any assumption that Colorado River flows going forward will be greater than historic flows of the 20th century is inconsistent with an emerging consensus that the 20th century hydrologic conditions were unusually wet. The hydrologic record speaks for itself (see chart below). Since the early 20th century, the 10-year running average of natural flows peaked in the mid-1920s (during negotiations of the Colorado River Compact) and has been on a steadily declining trend interrupted only by the large floods in the 1980s and a few favorable flows in the 1990s. The current 10-year running average is now around 13.5 million AF, the long-term average flow measured by tree ring studies. The current drought may simply be a return to long-term hydrologic conditions (See “Increasing Hydrologic Risk in the Colorado River Basin,” Hydrowonk Blog, January 28, 2013).
click to enlarge
Adjusted Probabilities of Shortage and Surplus
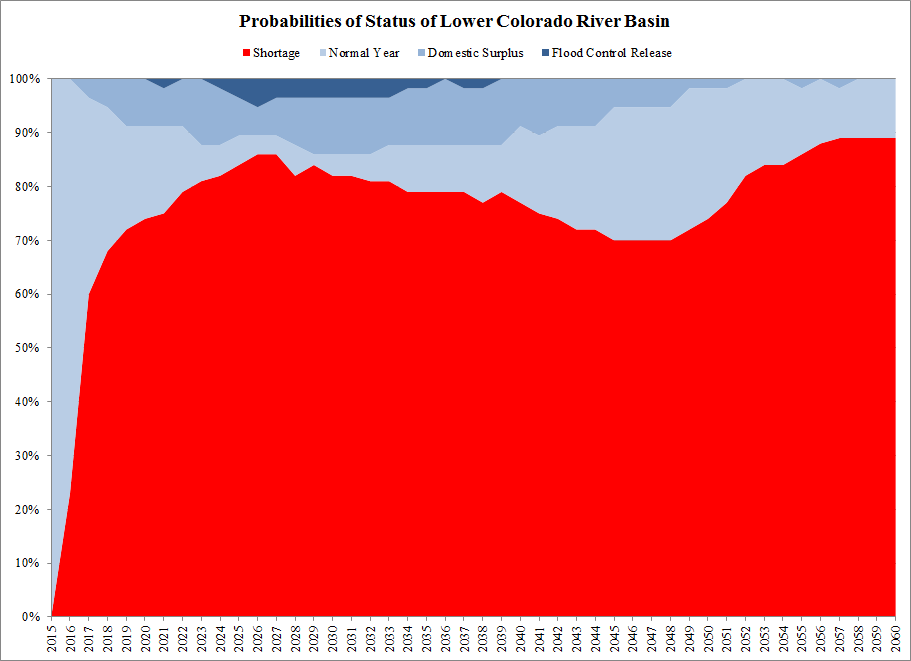
What are the projected probabilities if one focuses only on the model runs where the annual average natural flow of the Colorado River is less than 14.9 million acre feet? The chart below shows the probabilities of shortage, normal year, domestic surplus and flood control releases. The broad hydrological consensus is that the future of the Lower Colorado River Basin is one of shortage. By 2019, the annual probability of a shortage is 72% and the probability of a normal year is 19%. The probability of a domestic surplus is 9%. The probability of a shortage continues to increase through the 2020s when there is a small risk of flood control releases. Since flood control releases are a low probability event (once in a hundred years or so) with no time trend, the time dimension in the Bureau runs may reflect the fact that the Index Sequential Method takes the temporal realizations of the 20th century and superimposes them on the 21st century. This may be the case of being “fooled by randomness” (Nassim Michloes Talot argues that humans do not understand randomness and tend to see patterns in data that don’t exist, Fooled by Randomness: The Hidden Role of Change in Life and in the Markets). The bubble of flood control risk may be illusionary.
click to enlarge
Trend Analysis of the Annual Natural Flow of the Colorado River
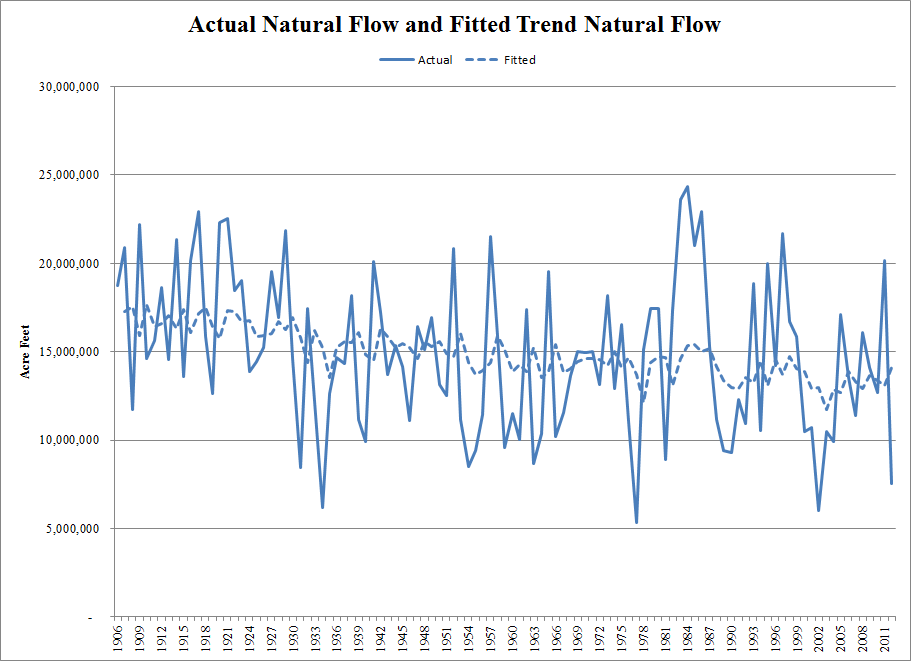
JOW conducted a statistical analysis of the historic record of the Annual Natural Flow of the Colorado River to quantify the trend and variability of river flows. The annual natural flow was declining by a statistically significant 0.21% per year for the historical record 1906-2012; or declining by about 2% per decade. The fitted trend in the annual natural flow fell from 17.3 million AF in the early 1920’s to 14.1 million AF by 2012 (see chart below). This trend analysis supports the emerging consensus that 21st century hydrology will be “less wet” than in the 20th century.
click to enlarge
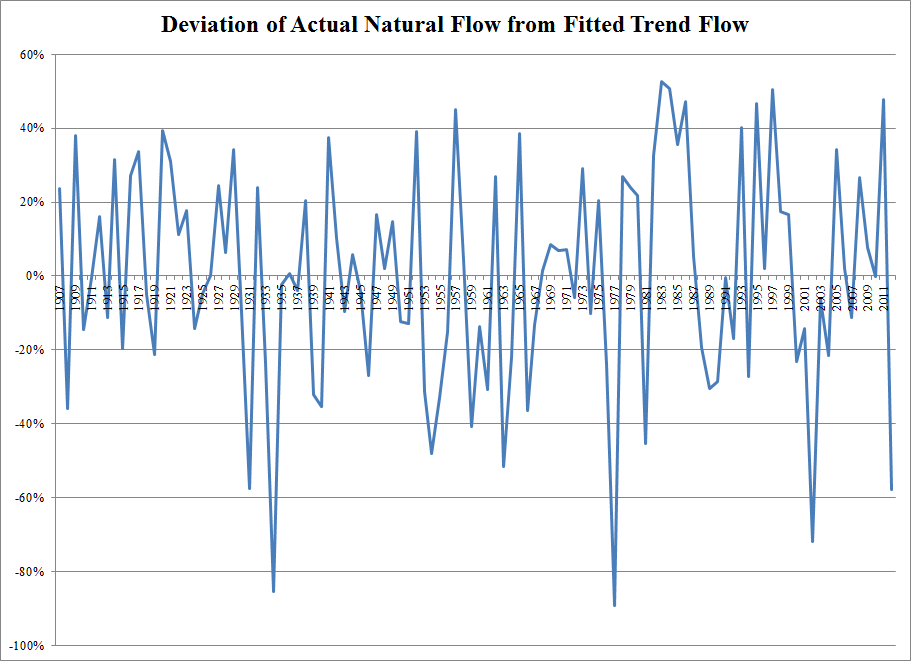
Risk management will become increasingly important for Colorado River water users. As shown in the chart above, there is substantial variability in annual natural flows relative to the fitted trend. The chart below shows how actual annual natural flows deviate from the fitted trend of natural flows in terms of percentages. Mother Nature is volatile and unpredictable (there is no correlation between the deviation in a year and the deviation in the prior year). Further, there was almost the same number of years with positive deviations (54 years) as with negative deviations (52 years) for the 106 years of data in the chart.
click to enlarge
There was modest evidence that the natural flow in an immediately prior year impacts the predicted natural flow in a current year (an 10% increase in natural flow in the prior year is estimated to increase current year natural flow by 1.6 percent relative to the declining trend in annual natural flow). This relation is responsible for the small fluctuations in the declining fitted trend for annual natural flows.
Final Thoughts
We all know that the Colorado River Basin has been in a severe drought for the past fifteen years. What is remarkable, of course, is that there have been no shortages declared. Instead, there has been significant drawdown of water stored in Lake Mead. Failure to take into account declining trend in the natural flow of the Colorado River (either due to a return to the long-term averages identified by tree-ring studies or climate change) will result in an underestimate of the future risk of shortages. As shown by the above analysis, not only are shortages in the Lower Colorado River Basin on the horizon, they are coming soon and are likely to become the “new normal” in the 21st century.
Written by Rodney T. Smith, Ph.D.
You must be logged in to post a comment.