Capital Markets

The water industry is becoming increasingly followed by the investment community.  There are four major Exchange Traded Funds listed today that enable investors to invest in the water industry in the United States and overseas.  A few water resource development firms are traded publicly.  One seawater desalination firm is traded in the United States. A handful of regulated water utilities are publicly held.  Capital markets may not be clairvoyant, but they can be informative about the consequences of trends and events in the industry.

Capital Markets provides information and analysis on developments concerning water exchange traded funds, water development firms and water utilities.  We create performance charts and indexes for industry segments, as well as provide occasional commentary.

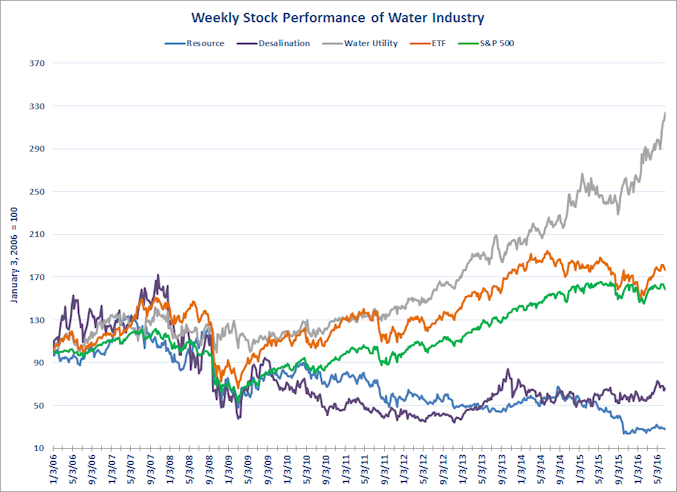
JOW tracks firms in three areas of the water industry:

  • Resource Development Firms: Cadiz Inc. (CDZI) and PICO Holdings (PICO)
  • Desalination Firm: Consolidated Water Company (CWCO)
  • Water Utilities: American States Water (AWR), American Water Works Company (AWK), California Water Service Group (CWT),
    and San Jose Water Company (SJW)
  • Exchanged Traded Funds (ETF): PowerShares Water Resources (PHO), First Trust ISE Water Idx (FIW), Guggenheim S&P Global Water Index (CGW),
    and PowerShares Global Water (PIO).

Occasional Capital Market Commentary: Water Utilities and California’s Drought June 2015

Occasional Capital Market Commentary Archive

Resource Development Firms

  • Capital Markets: Resource Development Firms, June 2016

    Cadiz Cadiz (CDZI) stock price has continued rising but remains below the level before the release of a letter dated October 2, 2015 by the Bureau of Land Management determining that the Cadiz Project is not within the scope of the Arizona-California Railroad right-of-way over federal lands. If the determination stands, BLM believes that the Cadiz Project would need BLM approval for a right-of-way over federal lands for the project’s water conveyance pipeline. (For background on the BLM…

Desalination

  • Capital Markets: Desalination Firm, June 2016

    Consolidated Water Company (CWCO) stock price is now 39.5% above its expected price.  The stock price now stands at 2.3% above the level prevailing 52 weeks ago. The stock price stands slightly above the 10-week exponential moving average.  The recent run-up in price reflects anticipation that the company’s consortium would be selected by the State of Baja to construct a 100,000-AF/year seawater desalination plant at Rosarito Beach. Consolidated was part of the consortium selected by the…

Water Utilities

  • Capital Markets: Water Utilities, June 2016

    American States Water American States Water (AWR) stock price now stands 1.4% above its expected price.  AWR’s price has increased by 11.3% over the past 52 weeks.  The stock price stands 3% above the 10-week exponential moving average.  The price declined significantly in late February when the company missed its earnings target.  Growth in its unregulated subsidiary was flat over the past year and litigation before the California Public Utilities Commission will not be resolved until…

Exchange Traded Funds

  • Capital Markets: Exchange Traded Funds, June 2016

    Powershares Water Resources Powershares Water Resources (PHO) stock still stands at 32.5% below its expected price.  Powershares price has decreased by 7.0% over the past 52 weeks. The stock price peaked in March 2014 and has been on a steady decline ever since. PHO stock had been over performing relative to the returns forecasted by the Capital Asset Pricing Model by an annual rate of 2.9% from January 2006 through December 2012. Powershares price has generally followed the expected…

The Indexes are based on equally-weighted portfolio of the underlying firms or funds in an industry segment starting on January 3, 2006.  Portfolios are rebalanced with inclusion of new entrants.  The value of the portfolios are normalized to 100 on the start date.

The Resource Development Firms, the Desalination Firm and the ETF’s crashed with the S&P 500 Index in fall 2008.  In contrast, stock prices of water utilities remained relatively stable.  With the turnaround in the S&P Index in 2009, the ETF Index jumped and caught up with the Water Utility Index by 2010.  The Resource Development Index and the Desalination Index generally followed the S&P Index until spring 2010 and fall 2009 respectively, when their fortunes separated—the former two starting a steady decline and the latter continuing to rise.  The ETF Index then fell off its rise with the Water Utility Index in the fall of 2011.  Since that time, the Water Utility Index continues marching ahead of the other segments, with ETF marching ahead of the S&P Index.  The Resource Index and the Desalination Index remain in steady decline.

The performance of an index reflects the performance of the index’s various components.  JOW uses the Capital Asset Pricing Model to measure a stock’s abnormal performance (measured by Alpha) and how the stock’s price moves with the market (measured by Beta).  The analysis is based on performance since January 3, 2006 through December 31, 2012.  Under performance by both resource development firms contributed to the decline in the Resource Development Index.  Desalination has also under-performed the market by about the same as the Resource Development Index.  The growth in the Water Utilities Index is driven by American Water Works and American States Water, although the other two utilities generated positive, though smaller, abnormal returns.  Domestic ETF’s outperformed Global ETF’s.

Group./Entity Alpha* Beta**
Resource Development    
   Cadiz Company -6.1% 1.21
   PICO Holdings -4.9% 1.09
Desalination    
    Consolidated Water Company -4.3% 1.01
Water Utilities    
   American States Water 8.2% 0.79
   American Water Works 12.3% 0.50
   California Water Service Group 2.4% 0.68
  San Jose Water Company 2.8% 1.03
Exchange Traded Funds    
   PowerShares Water Resources 2.9% 1.22
   PowerShares Global Water -2.2% 1.09
   First Trust ISE Water Idx 6.4% 1.22
   Guggenheim S&P Global Water Index 1.6% 1.13

* annual return in excess of return estimated by Capital Asset Pricing Model

** measure of how return varies with return on S&P 500 Index.

Definition of Capital Asset Pricing Model: a finance model relating the expected return of a risky asset (such stock) to a “risk free” return, such as U.S. Treasury Notes, plus a risk premium equal to the difference between the expected return on a diversified portfolio, such as the S&P 500 Index and the risk free return, multiplied by “Beta”.

Expected Stock Price: calculated by taking closing price for last week of 2012 adjusted weekly by the firms expected return from the Capital Asset Pricing Model

For a focus on more recent performance, see the “Performance Charts” for each firm and ETF.