On March 2, 2015, California’s Department of Water Resources (“DWR”) announced an increase in the 2015 SWP allocation from 15% to 20%. In increasing the SWP Allocation from the mid-January announcement of 15%, DWR noted that storms in early February were responsible for the increased 2015 SWP Allocation.
DWR’s declared 2015 SWP allocations are being adjusted in response to storm events. DWR’s initial 2015 SWP Allocation, announced on December 1, 2014, was 10%. The increase to 15% in mid-January reflected mid-December storms that increased river flows. According to DWR, “tight coordination among federal and state water and wildlife-protection agencies allowed the SWP to store runoff south of the Sacramento-San Joaquin Delta without violating statutory and regulatory obligations to protect wildlife and water quality.”
Increase in SWP Allocation Anticipated
The increased 2015 SWP Allocation was anticipated in a February 18th post in the Hydrowonk Blog predicting an increased 2015 SWP Allocation to 21% (see “What Will Be the Final SWP Allocation for 2015?,” Hydrowonk Blog, February 18, 2015). (Hydrowonk’s executive blogger is JOW’s editor). The forecasted level of Final SWP Allocations is based on a study of SWP Final SWP Allocations since 1990 when SWP contract amounts reached full build-out.
Final SWP Allocations are well-explained by the amount of water in storage at Lake Oroville at the beginning of the water year and the actual precipitation from October through April (measured by the Northern Sierra 8 Station Precipitation Index). See chart below. The model predicts about three-fourths of the annual variation in Final SWP Allocations. As expected, the Final SWP Allocation is greater, the more water in storage at Oroville at the beginning of the water year and the greater the actual amount of precipitation measured by the Northern Sierra 8 Station Precipitation Index, October through April of the water year. There was also a modest increasing trend in Final SWP Allocations of 0.8 of a percentage point per year from 1990 through 2002, that was reversed in 2003. Since then, the expected Final SWP Allocation is declining by 3.0 percentage points per year.
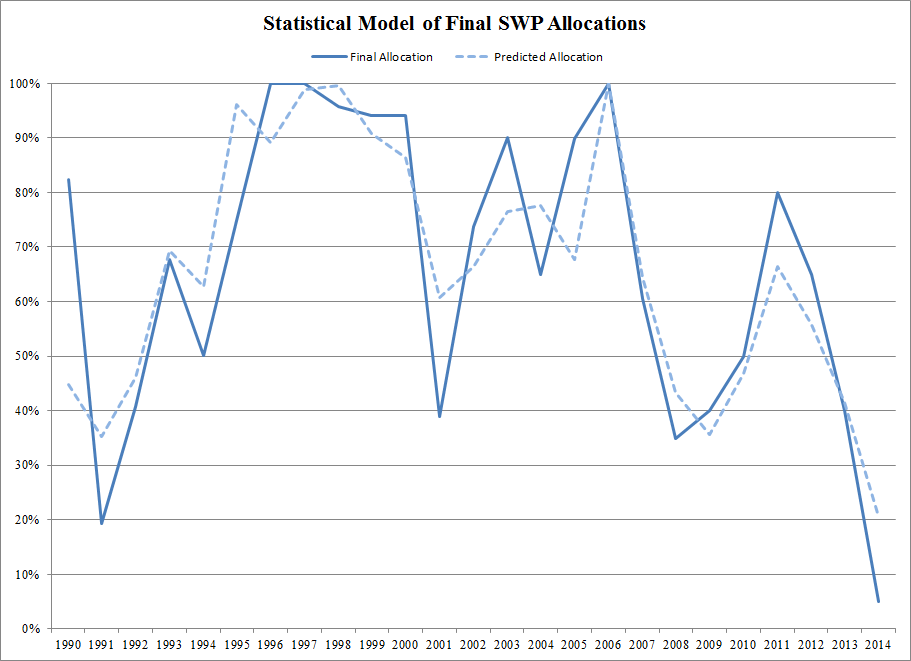
click to enlarge
Updated Forecast
The projections for the 2015 Final SWP Allocation is based on statistical modeling of the relation between actual precipitation from October through April and cumulative precipitation from October to the month prior to the forecast. The storms in early February that bumped DWR’s 2015 SWP Allocation to 20% were anticipated by the statistical modeling. The forecast for this water year’s October through April precipitation went from 43.4 inches (based on actual precipitation this year through January) to 42.3 inches (based on actual precipitation this year through February). See chart on Precipitation Index and forecasts, below. This forecast is about 8 inches below the historical average of actual precipitation from October through April for 1990-2014, but about 14 inches above actual precipitation last water year. The actual precipitation through February (30.7 inches) is 4.5 inches below the average precipitation through February for 1990-2014 (35.2 inches).
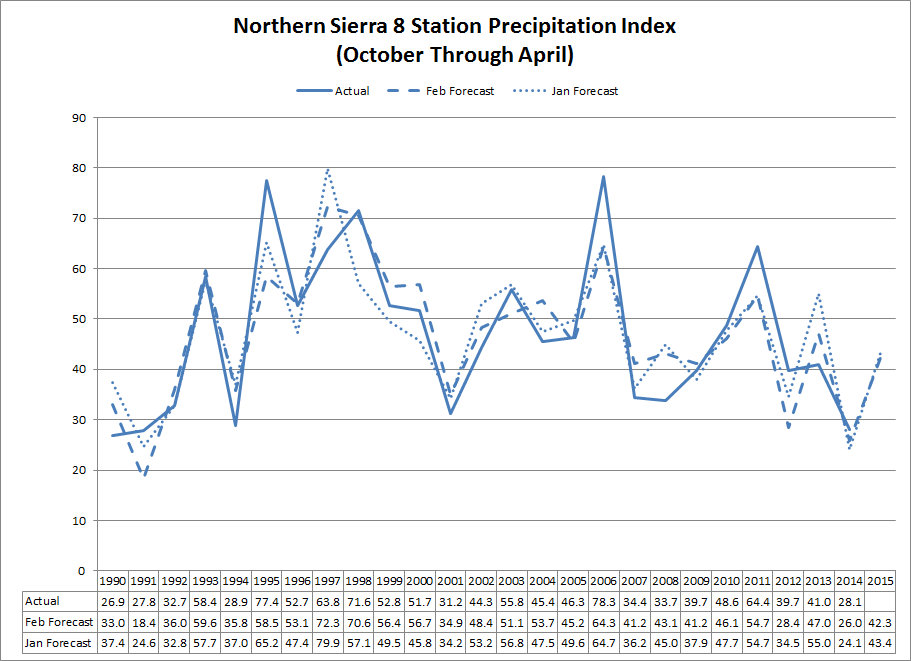
click to enlarge
The updated forecast projects an expected Final 2015 SWP Allocation of 20%, DWR’s current announced allocation. Models, of course, have underlying variability in their predictions (see the Probability Distribution of Forecasted 2015 SWP Final Allocations chart). The probability of a zero allocation is 7%. There is about a 54% chance that the final allocation will be below the current 20% allocation. On the flip side, there is about a 46% chance that the final allocation will be above the current 20% allocation.
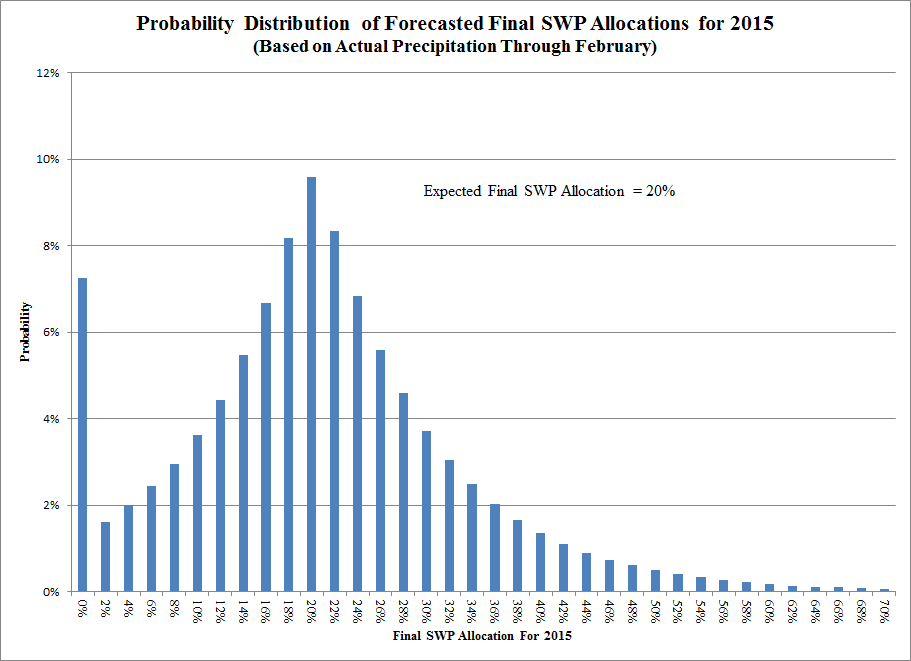
click to enlarge
There are two factors to keep one’s eye on as we wait for the Department of Water Resources determination of the Final SWP Allocation for 2015.
First, there is the fickleness of Mother Nature. Will precipitation be normal, above normal or below normal for March and April? The forecasts are based on an expected precipitation of about 11.6 inches in March and April, which is about the average precipitation for those months (11.8 inches). Will precipitation be above or below average in March and April?
Second, there are man-made actions. Will the trend decline of 3 percentage points per year for the Final SWP Allocation adequately capture reduced allocations from regulatory constraints?
Written by Rodney T. Smith, Ph.D.
You must be logged in to post a comment.