On December 1, California’s Department of Water Resources announced an initial allocation for the State Water Project (“SWP”) of 10% for most SWP contractors (four SWP contractors north of the Delta received 15% allocations). The initial allocation reflects current and projected hydrologic conditions, including California’s persistent drought conditions, as well as low storage in SWP facilities, SWP operational constraints under its water right permits, the Biological Opinions for Delta Smelt and Salmon, the Longfin Smelt incidental take permit, and the 2016 Contractor demands. As has been common practice for many years, SWP contractors submitted demands equal to the Table A contract amounts, totaling 4,172,786 AF. DWR cautioned that the allocation may be reduced if severely dry conditions develop.
The 10% initial SWP Allocation is consistent with the median forecast from the Final SWP Allocation Model based on a study of the historic record of SWP Allocations. Reflecting the variability in hydrologic conditions (as well as the forecast error of Final SWP Allocation Model), there remains a wide range of Final SWP Allocations depending on actual hydrologic conditions. There is almost a 25% chance that the final SWP Allocation may be zero!
Historical Record of Final SWP Allocations
The history of SWP allocations has three distinct time periods (see history chart). Between 1968 through 1989, SWP allocations averaged more than 90%. Spurred by the 1991 drought, SWP allocations dropped and averaged 74% through the 1990s. There was a brief recovery in SWP allocations, increasing by 10 percentage points until the early 2000s. Since then, average SWP allocations have been declining. The last two years have witnessed the lowest allocations on historic record. The SWP Final Allocation for 2014 was only 5% (most of the year the declared SWP Allocation was zero). The Final Allocation for 2015 was 20%.
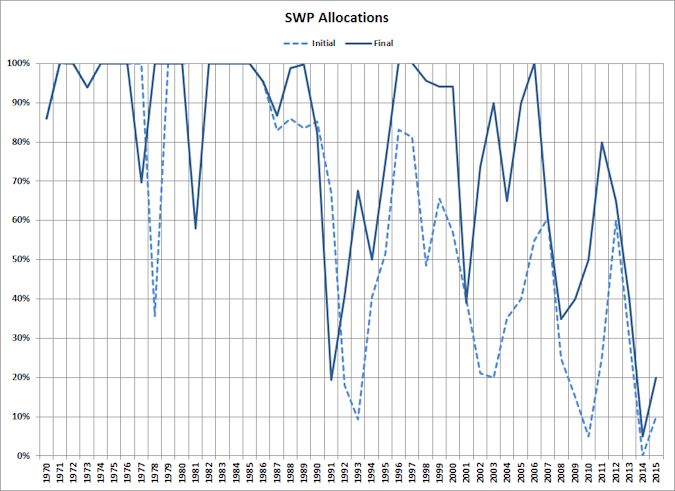
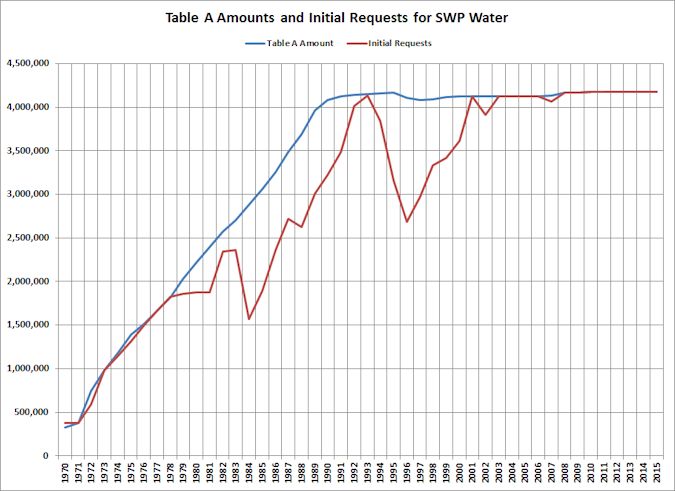
The period of 90%+ SWP Allocations corresponded to the scheduled build-up of the SWP (see build up chart). SWP Contract Amounts grew until 1990. Therefore, the relevant historical period for thinking about SWP Allocations going forward is the post-1989 record. After the Monterey Amendments to SWP contracts, SWP contractors now request their full contract amount each year.
Model of SWP Final Allocations
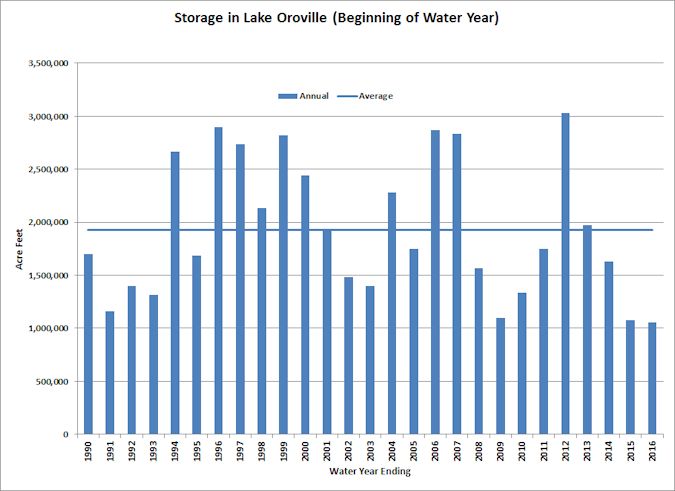
Department of Water Resources looks at a variety of factors in setting SWP Allocations. Two key factors is the amount of water in storage at Oroville at the beginning of the water year (October 1) and forecasted and actual precipitation and runoff.
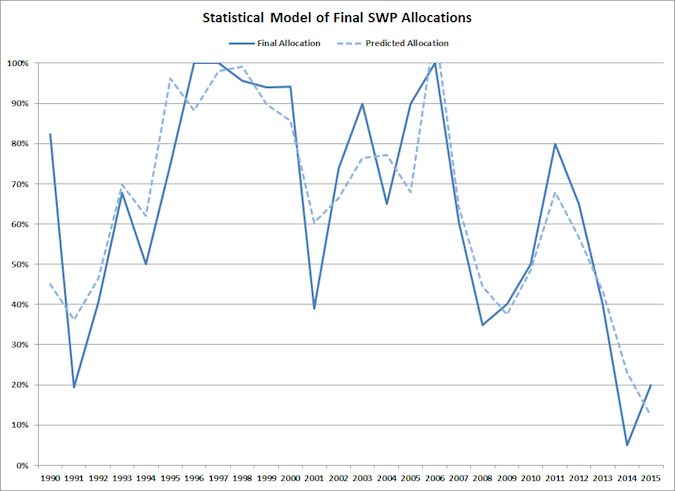
The Journal of Water conducted a statistical analysis of Final SWP Allocations between 1990 and 2015. The resulting model predicts about three-fourths of the annual variation in Final SWP Allocations (see model chart). As expected, the Final SWP Allocation is greater, the more water in storage at Oroville at the beginning of the water year and the greater the actual amount of precipitation measured by the Northern Sierra 8 Station Precipitation Index, October through April of the water year. There was also a modest increasing trend in Final SWP Allocations of 0.8 of a percentage point per year from 1990 through 2002, that was reversed in 2003. Since then, the expected Final SWP Allocation is declining by 3.0 percentage points per year.
Conditions for 2016
Start with bad news first. Water storage in Lake Oroville stood at 1,059,903 acre-feet on October 1, 2015 (start of the 2015-2016 water year), almost 500,000 AF below average. With a final SWP Allocation of 20% in 2015 and meager water storage going into this water year, it is understandable that DWR’s Initial SWP Allocation for 2016 is less than last year’s.
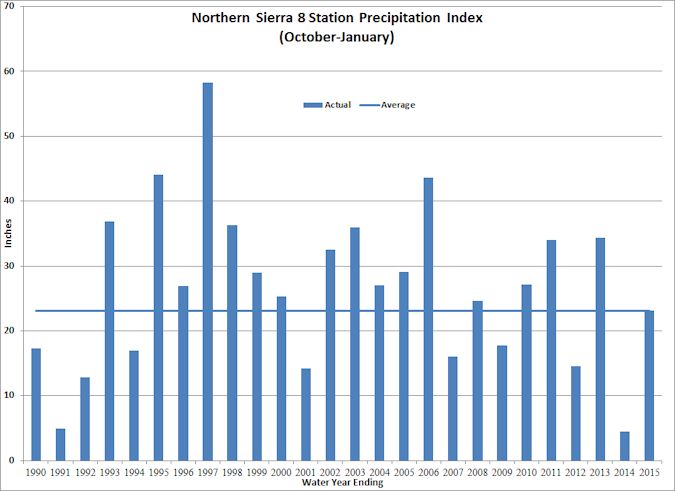
Precipitation at the start of this Water Year has been disappointing. The Northern Sierra 8 Station Precipitation Index stands at 4.9 inches for October through November (see Northern Sierra 8 Station Precipitation chart). This is about one-third less than last year’s level at the same time period. Even if precipitation eventually catches up with last year’s levels, precipitation for this Water Year would still be 30% below the historical average.
Predictions for 2016
For the JOW model, the only unknown factor (in addition to the underlying variability in the model’s predictions) is what, in fact, will be the cumulative precipitation for October through April. The projections assume that expected precipitation will be 70% of the historical average with a variability in conditions reflecting the variability of actual precipitation found in the historical record.
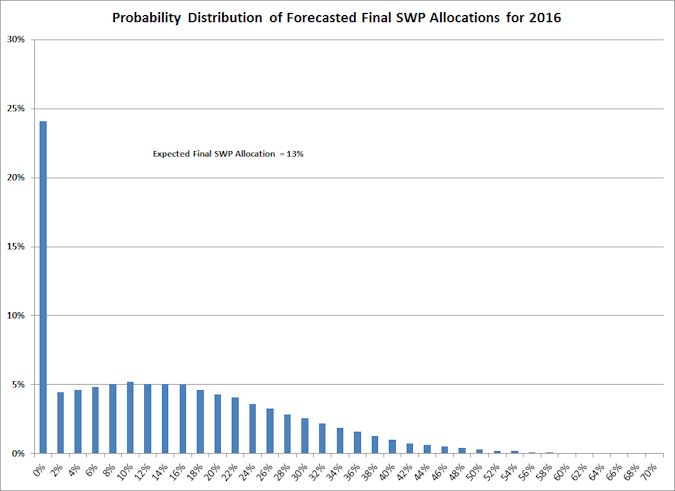
Models, of course, have underlying variability in their predictions. See the Probability Distribution of Forecasted SWP Final Allocations chart for 2016. The expected SWP Final Allocation for 2016 is 13%. The probability of a zero allocation is 24%. The median prediction is 11%. There is about a 50% chance that the final allocation will be below the current 10% allocation. On the flip side, there is about a 50% chance that the final allocation will be above the current 10% allocation.
Final Thoughts
There are two wild cards to keep one’s eye on as we wait for the Department of Water Resources determination of the Final SWP Allocation for 2016.
First, there is the fickleness of Mother Nature. What will the precipitation be in the coming months?
Second, there are man-made actions. What will be the impact of environmental constraints on project operations? Does the model’s trend decline of 3 percentage points per year for the Final SWP Allocation capture reduced allocations from regulatory constraints?
In the end, there is much uncertainty surrounding the outcome. JOW will update the predictions monthly for actual precipitation in January through April.
Written by Rodney T. Smith, Ph.D.
You must be logged in to post a comment.