Current Conditions
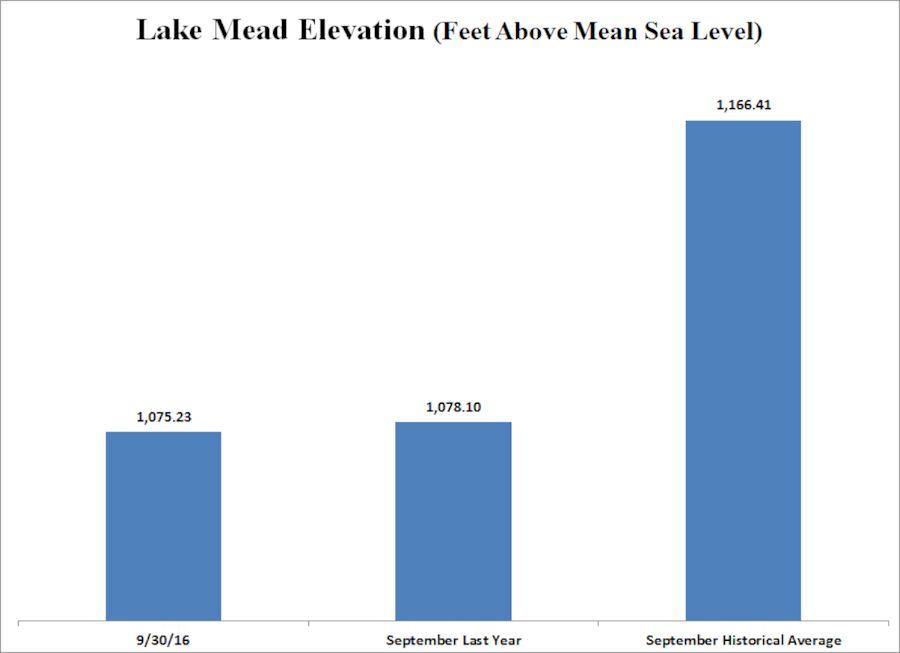
Lake Mead: Lake Mead’s elevation at the end of the third quarter 2016 was 2.87 feet below the elevation at the end of September 2015 and 91.18 feet below the historical average of Lake Mead.
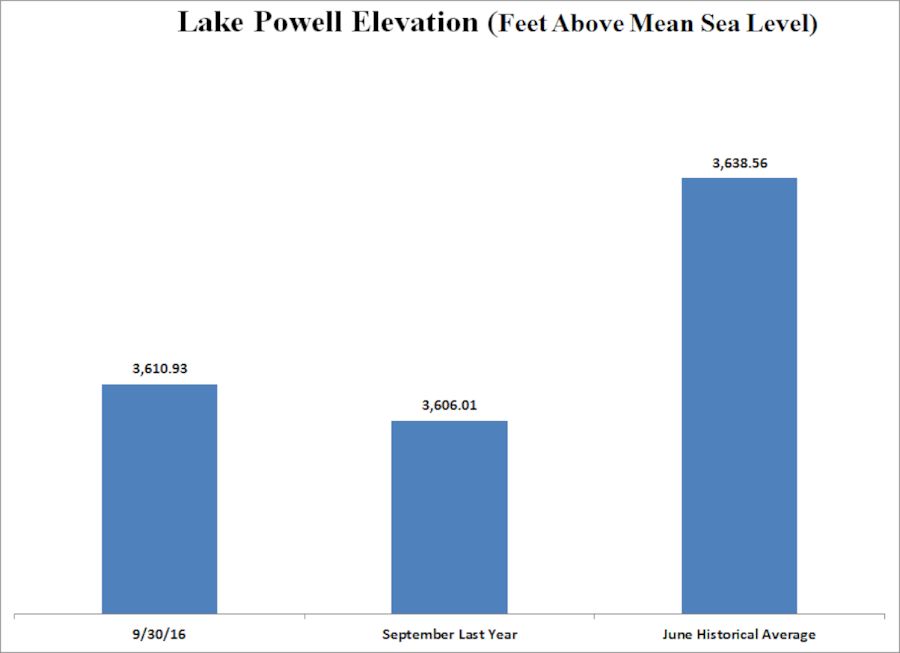
Lake Powell: Lake Powell’s elevation at the end of the third quarter 2016 was 4.92 feet above the elevation of at the end of September 2015 and 27.63 feet below the historical September elevation of Lake Powell.
24-Month Study
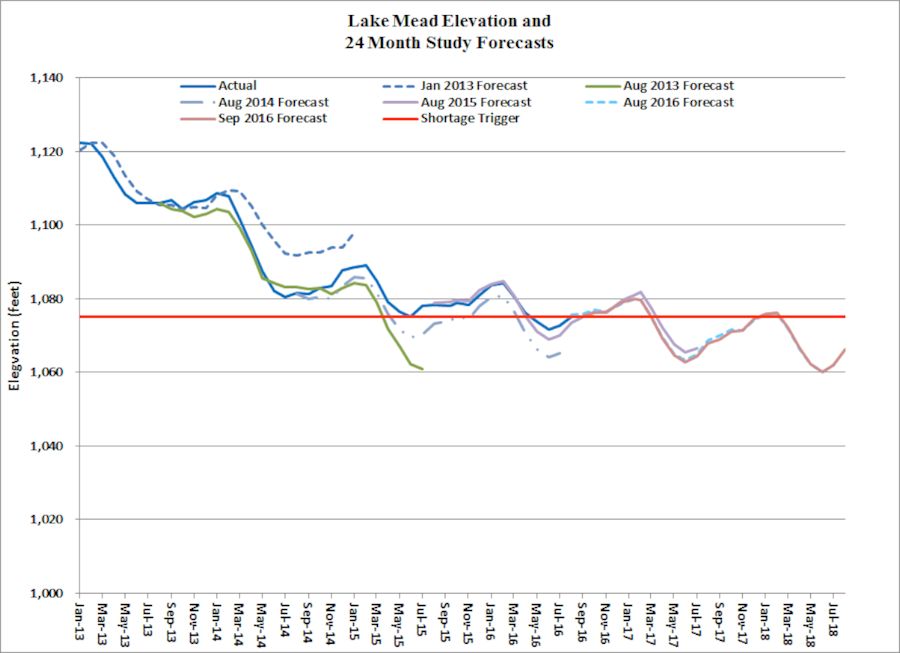 Lake Mead: The 24-Month Studies released during the 3rd quarter all project that Lake Mead’s January 2017 elevation will be more than 1,080 feet, more than 5 feet above the trigger for a declaration of a shortage condition for 2017. The July 24-Month Study projected a level of 1,080.43, while the August and September 24-Month Studies both projected a level of 1,080.02.
Actual Lake Mead elevations in 2013 through early 2014 followed projections from the January 2013 study, when actual elevations plummeted generally in tandem with the projections from the August 2013 study. The August 2014 study projected a slight increase in Lake Mead elevations which was slightly below actual elevations. With a rebound in inflows, the forecasts prepared in summer 2015 were above the August 2014 forecast.
The August 2015 study forecasted that Lake Mead elevations would fall below the trigger for shortages in late spring 2016 (which proved true) but would rebound towards the trigger for January 2017. The July, August and September 2016 projections generally are slightly above the August 2015 projections through November 2016; then they fall below the August 2015 projections. With the critical August 2016 declaration above the trigger, no shortage will be declared for 2017.
The continuing trend of progressively lower “highs” in successive winter elevations and lower “lows” in successive summer elevations belies a continuing downward trend in Lake Mead elevations. A Bureau of Reclamation briefing on Colorado River System Future Conditions 2017-2021 shows near even chances to a shortage declaration in 2018 and even greater chances in subsequent years.
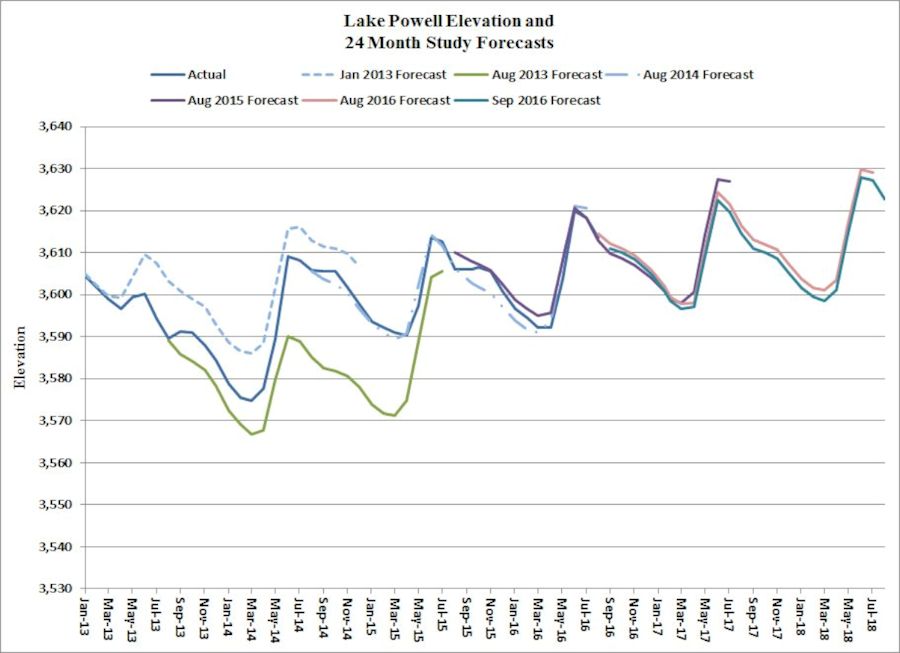 Lake Powell: During the 3rd quarter of 2016, the previously projected upward trend in Lake Powell elevations reversed. The July 2016 forecasts for Lake Powell elevations are above June 2016 forecasts through April 2017; then they fall below the June projections. The August and September 2016 forecasts are below the levels forecasted in the previous month.
Actual Lake Powell elevations in 2013 were generally running below forecasted levels in January 2013, but above the levels projected in the August 2013 study. Actual elevations have generally tracked the projections in the August 2014 study.
The August 2015 study projected elevations above the August 2014 study. The July and August 2016 studies project elevations slightly above the August 2015 study projections through March 2017, then they fall below the August 2015 projections. The September projections follow a similar pattern with projected elevations running above the August 2017 projections through January 2017.
Lake Powell has had a trend of progressively higher “highs” in successive June elevations and higher “lows” in successive March elevations. Current projections suggest that the trend will break with Lake Powell elevations reaching a peak in March 2017.
Monthly Elevations
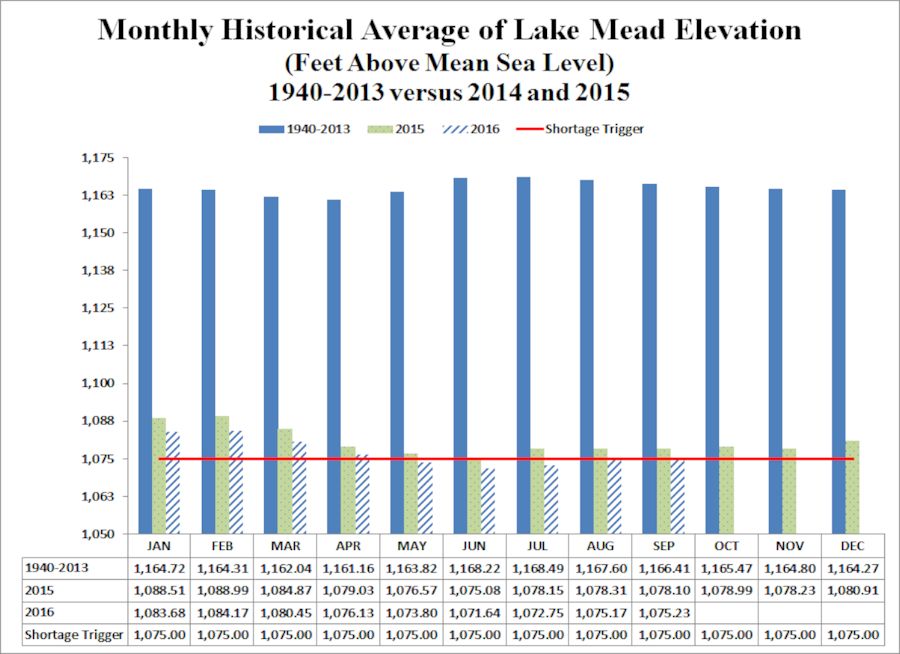
Lake Mead: Monthly elevations in 2016 are lower than in 2015 and continue to run more than 90 feet below the historical average monthly elevations after dropping from about 80 below the historical monthly averages in May 2016.
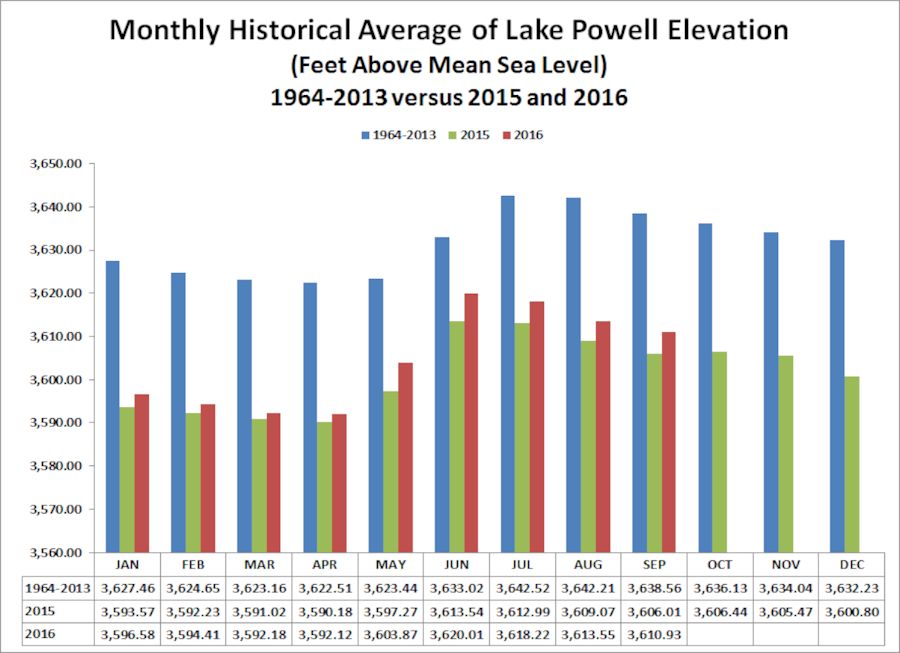
Lake Powell: Monthly elevations are running higher in 2016 than 2015 but are more than 20 feet below historical monthly average elevations.
You must be logged in to post a comment.