At its December meeting, the Board of Directors of the Metropolitan Water District of Southern California approved adjustments to its Water Supply Allocation Plan (“WSAP”) for allocating water supplies to its member agencies in times of declared water shortages. The original WSAP was adopted in February 2008 and implemented from July 1, 2009 through June 30, 2011 when Metropolitan’s storage levels had fallen to low levels during drought conditions.
The staff notes that Metropolitan managed to avoid declaring a water shortage in 2014 by drawing down its water storage. But circumstances may be changing: “prudent management of remaining storage if severe drought conditions continue into 2015 will likely result in Metropolitan imposing mandatory supply allocations.”
The WSAP is a “needs-based” method that uses financial incentives for water conservation. A baseline is established by the difference between retail water demands in a member agency’s service area and local supplies. Under the original WSAP, a Penalty Rate was charged at two times the “fully encumbered” Tier 2 untreated water rate for water use between 100 percent and 115 percent of supply allocations and four times the Tier 2 untreated water rate for water use in excess of 115% of supply allocations (see table).
Incentives under Original and Revised WRAP
| Water Use Above Supply Allocation | Penalty Rate | Allocation Surcharge | Increase |
| 100% to 115% | $1,428 | $1,480 | $52 |
| Greater than 115% | $2,856 | $2,960 | $104 |
Tier 2 Untreated water rate in 2015: $714/AF
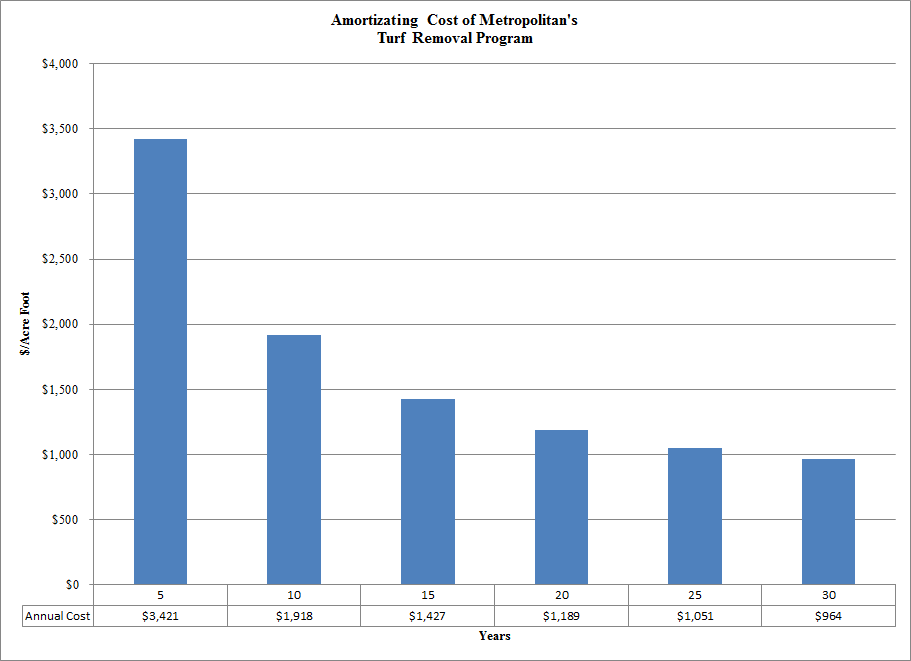
The adjusted WSAP now involves an Allocation Surcharge based on the marginal cost of water conservation (Metropolitan pays homeowners $2 per square foot for turf removal). With annual water savings of 44 gallons per square foot, this program yields water conservation at $14,811 per acre foot. Amortizing the cost over 10 years (without interest), the annual cost of water conservation is $1,480/AF. The Allocation Surcharge is, therefore, $1,480/AF for water use above 100% to 115% of supply allocation. The Allocation Surcharge for water use greater than 115% of supply allocation is doubled to $2,960 per acre foot. The Allocation Surcharge exceeds the Penalty rate by $52/AF for water use above 100% to 115% above supply allocation and by $104/AF for water use greater than 115% of supply allocation.
A key point of the adjustment is that the Allocation Surcharge is based on a cost-of-service charge. The Penalty Rate was not based on cost-of-service. The revenues generated by the Allocation Surcharge will go to increased funding of water conservation.
The interest-free amortization, of course, understates the actual economic cost of turf removal. Using a 5% interest rate (that reflects long-term yield on 10-Year Treasury notes and a 50 basis point risk premium), the annual cost of turf removal for a 10 year amortization period is $1,918/AF, or $438/AF higher than the interest-free amortization (see figure). Therefore, basing the Allocation Surcharge on the cost-of-service of additional water conservation would support even greater financial incentives in the WSAP. If turf removal programs prove water savings last longer than 10 years, then the annual cost of water conservation from the one-time payment to homeowners would fall considerably.
The WSAP Allocation for consumptive uses (water use other than for groundwater replenishment and seawater barriers, which receive separate allocations) reflects retail water demands less local supplies for 2015 (see table for 2015 allocations). For comparison, the Pro Rata Baseline allocates 1,764,551 AF among member agencies by average annual purchases of Metropolitan water for consumptive uses in FY 2012-13 and FY 2013-14. All but seven member agencies (Anaheim, Central Basin, Compton, Fullerton, San Diego County Water Authority, Santa Monica and Upper San Gabriel) receive a larger allocation under WSAP than they would under the Pro Rata Baseline. The 1,764,551 AF WSAP Baseline is 11,719 AF below member agency purchases of Metropolitan water in FY 2012-13 and 182,264 AF below member agency purchases of Metropolitan water in FY 2013-14.
Member Agency WASP Baseline for 2015
| Member Agency | WASP Baseline | Pro Rata Baseline | Percentage Difference |
| Anaheim | 14,604 | 16,465 | -11.3% |
| Beverly Hills | 11,402 | 10,780 | 5.8% |
| Burbank | 8,908 | 7,794 | 14.3% |
| Calleguas | 111,460 | 107,405 | 3.8% |
| Central Basin | 32,390 | 33,865 | -4.4% |
| Compton | 154 | 819 | -81.2% |
| Eastern | 106,905 | 95,520 | 11.9% |
| Foothill | 9,459 | 8,593 | 10.1% |
| Fullerton | 8,288 | 8,522 | -2.7% |
| Glendale | 21,011 | 18,534 | 13.4% |
| Inland Empire | 68,461 | 59,760 | 14.6% |
| Las Virgenes | 22,807 | 21,376 | 6.7% |
| Long Beach | 30,975 | 27,449 | 12.8% |
| Los Angeles | 480,536 | 396,231 | 21.3% |
| MWD Orange County | 182,582 | 181,200 | 0.8% |
| Pasadena | 22,695 | 19,598 | 15.8% |
| San Diego County Water Authority | 334,254 | 473,741 | -29.4% |
| San Fernando | 101 | 85 | 19.1% |
| San Marino | 1,277 | 1,136 | 12.4% |
| Santa Ana | 11,143 | 10,805 | 3.1% |
| Santa Monica | 5,454 | 5,797 | -5.9% |
| Three Valleys | 65,044 | 59,929 | 8.5% |
| Torrance | 16,655 | 16,145 | 3.2% |
| Upper San Gabriel | 2,657 | 3,327 | -20.1% |
| West Basin | 117,395 | 111,256 | 5.5% |
| Western | 77,934 | 68,423 | 13.9% |
| Total | 1,764,551 | 1,764,551 |
Source: Attachment 2 to Metropolitan Board Letter 8-2 dated December 9, 2014
Pro Rata Baseline: Allocating 1,764,551 AF among member agencies by average annual purchases of Metropolitan water for consumptive uses in FY 2012-2013 and FY 2013-14.
The WSAP also provides allocations for groundwater replenishment (150,000 AF) and seawater barrier (15,200 AF). These maximum allocations are separate from the above municipal and industrial allocations and are based on a 10-year historical average of groundwater replenishment. Groundwater replenishment must go to groundwater replenishment connections (no in-lieu deliveries). Any groundwater replenishment allocation taken by a member agency will reduce the adjustments in the above WSAP allocation for reduced groundwater production.
WSAP Member Agency Maximum Potential Groundwater Replenishment and Seawater Barrier Allocations
| Member Agency | Groundwater Replenishment | Seawater Barrier | Total |
| Anaheim | 3,000 | 3,000 | |
| Beverly Hills | |||
| Burbank | 2,800 | 2,800 | |
| Calleguas | |||
| Central Basin | 23,100 | 23,100 | |
| Compton | |||
| Eastern | 7,000 | 7,000 | |
| Foothill | |||
| Fullerton | 2,700 | 2,700 | |
| Glendale | |||
| Inland Empire | 17,100 | 17,100 | |
| Las Virgenes | |||
| Long Beach | 5,100 | 4,000 | 9,100 |
| Los Angeles | |||
| MWD Orange County | 51,100 | 51,100 | |
| Pasadena | |||
| San Diego County Water Authority | |||
| San Fernando | |||
| San Marino | |||
| Santa Ana | 3,500 | 3,500 | |
| Santa Monica | |||
| Three Valleys | 5,100 | 5,100 | |
| Torrance | |||
| Upper San Gabriel | 29,500 | 29,500 | |
| West Basin | 11,200 | 11,200 | |
| Western | |||
| Total | 150,000 | 15,200 | 165,200 |
The allocations adopted by the Board are starting points for member agencies. Using FY 2012-13 and FY 2013-14 as the base period will require Metropolitan staff to make adjustments for mandatory use restrictions or rationing during these years. Staff will also update the method for calculating the “demand hardening” from conservation efforts. There will also be consultations with member agencies regarding groundwater replenishment for meeting groundwater management objectives and consideration of severe and/or inequitable financial impacts.
Written by Rodney T. Smith, Ph. D.
You must be logged in to post a comment.