Water resource management is in the midst of decades’ long gridlock. Is change around the corner? Soon, very soon.
Water resource management includes assessment and review of significant projects involving infrastructure investment, resource development and water conservation. Should a proposed dam be built? How should it be operated to address different water uses and interests? How should a potential groundwater resource be developed, if at all? How should agricultural and urban water use adapt to changing economic, environmental and hydrologic circumstances? What is the role of desalination projects in a community’s water supply portfolio? Water resource management faces a long list.
Water resource management is in the midst of decades’ long gridlock. At the same time, the resource challenges don’t abate, they intensify. Is change around the corner? Soon, very soon.
Gridlock in Water World
Much like Washington these days, water resource management faces gridlock. Controversies are not settled. Instead, they linger for decades. Delay serves the strategic interests of the “parties of no”. Extended conflict builds business for professional service firms. What gridlock does not serve is addressing the real water resource challenges emerging throughout the world.
Environmental review has become the bedrock tool of water resource management. Define the “no project alternative”, the proposed project and project alternatives. Assess the environmental consequences of the alternatives. If a project is undertaken, devise and implement mitigation plans. For the unavoidable impacts, determine whether there are “over-riding concerns” that justify proceeding. This conceptual toolbox has a certain inalienable logic.
With more than a half century of experience, it is safe to say that environmental review rarely creates consensus and yields few projects. For controversial projects (that is, projects advocating significant change to address significant long-term problems), environmental review is often a forum for “dueling experts” and exchange of passionate concerns about our future and where water resource management is heading. The review process alone takes years. Then, the litigation phase kicks in. Years stretch into a decade or longer.
In the end, water resource management becomes dominated by advocacy. Lawyers conjure up theories and facts in the courtroom. Lobbyists spin political talking points to push client agendas. At least in the latter case, the “political marketplace” provides for competition in ideas that involves many decision-makers in the legislative and executive branches. In the former case, one is running a litigation lottery on a single judge at the trial court level and a handful of judges at the appellate levels. How often does litigation prove decisive? Decisions are just another turn in a “long and winding road.” Sagas continue.
There are many legislative proposals about how to improve this process, but these are not the focus here. Instead, the focus is on the consequences of delay and inaction.
When Will the Bell Toll on Delay?
As with other things in life, delay and inaction are not free. Without change, environmental problems worsen, they rarely get better. Without new action, water supply reliability deteriorates as growing demands stress existing supplies.
Examples abound about growing environmental problems from lack of effective action: witness the Bay-Delta in California and the Edwards Aquifer in Texas. In both instances, the lack of success has not been from a lack of trying. But it means that the problems today are larger than those a few decades ago. Again, I don’t focus on the intensifying environmental problems other than to acknowledge that they are real and troubling.
A simple water supply parable illustrates that there are “tipping points” in the consequences of delay (I suspect that there are comparable ones for environmental issues). A tipping point is where a critical mass or threshold is reached where seemingly small things can make fundamental and permanent transformations in systems.
A Water Supply Parable
The water supply parable involves a long-term project based on surface water storage. The numbers are illustrative. The project involves an annual demand of 100,000 AF at build out. The project starts storing water from its available source three years in advance of the start of deliveries. Annual demand starts at 25% of build-out (25,000 AF) in the first year of deliveries and grows over 40 years to reach demand at build-out. (The implied annual growth in water demand is 3.6 %.) Assuming that water storage started in the year 1960, deliveries started in the year 1963, the demand at full build out was reached in the year 2002. Thereafter, demand growth slows down to an annual rate of 1.5%.
The water source behind this project has an average annual yield of 100,000 AF. There is variability in annual availability. The parable assumes that the distribution of available water supplies follows a log normal distribution with an expected yield of 100,000 AF and a standard deviation (statistical measure of variability) of 20%. The project includes carryover storage equal to 300,000 AF (three times annual demand at build out).
Now, water planners understand that they need to invest in expansions in order to meet further demand growth beyond the full build out of the initial project. Suppose they initiate efforts a decade in advance. However, they are stymied by gridlock in water world.
History and the future are driven by random draws from the statistical distribution of the project’s water source. These random draws generate a defined sequence of annual supply of available water. Available water not needed to meet current demand is placed into storage, provided that there is available unused storage capacity. When annual water supply is insufficient to meet demand, water is withdrawn from storage to avoid water shortages. A shortage occurs when the available amount of water available from the project’s supply plus takes from storage are insufficient to meet water demand.
Tech Note: The analysis below is based on a Monte Carlo study of 1,000 iterations of a sequence of random draws from the statistical distribution for the annual project supply of the parable. The statistical distributions of likelihood of shortages and size, and expected end of year (“EOY”) carryover storage are defined by the distribution of outcomes over the 1,000 iterations.
Project Performance
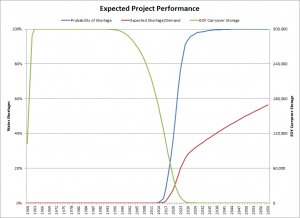
The chart below shows expected project performance. The project’s carryover storage is expected to be full through the first 35 years of the project (until the mid-1990s), about a decade before demand reaches full build out. As demand reaches full build-out, the chance that available water supply can meet water demand is dwindling. Therefore, water will be expected to be drawn from storage to meet current demands. Carryover storage starts a secular decline. With no new water sources or increased storage, a history of complete supply reliability turns into a future of supply unreliability.
Water shortages begin emerging within a decade of reaching full build out and more than five decades after the start of the project. Carryover storage is drawn down to offset below average yields from the project’s water source and continued growth in water demand. Within a decade of full build out of the project (without further water sources or storage), the project reaches a “new normal” of significant, regular and increasingly severe water shortages. Within 20 years after their start, shortages are a virtual certainty. Their expected magnitudes are devastating as they break through 20% and march steadily towards 60%.
In the face of these dynamics and without change, the growth in water demand would not be viable. Note that if demand growth occurs, carryover storage is expected to be fully depleted within 30 years of full build out, or a decade after the transition from full supply reliability to supply unreliability.
There are two major takeaways from the parable. Secular decline in carryover storage from near or at full storage capacity is an “indicator species” for a system on its way from complete water service reliability (historically) to supply unreliability in the future. Actual experience will not be as smooth as expected project performance. Deluges in annual supplies from the project source (a statistical possibility) can obscure trends. Without new supply sources or new storage, it is only a matter of time. Mother Nature’s beneficence (in terms of a few years of high volumes of annual water supplies) can only delay the inevitable.
The second takeaway is how rapidly the circumstances change once they start. There is only a decade transition in the system! If gridlock defers action until the first shortages emerge, the system has little time to adapt and evolve from gridlock to affirmative solutions.
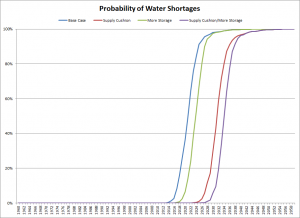
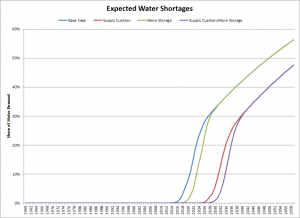
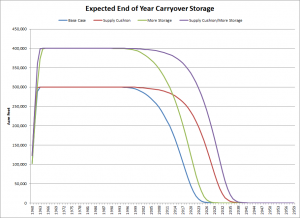
The assumptions used in constructing the parable, of course, matter at some level. The project could have had a supply cushion in the sense that the expected annual supply exceeds demand at full build out. The project could have more storage than assumed. To illustrate, consider four difference scenarios:
- Base Case: 100,000 AF expected annual supply and storage three times demand at full build out (this was discussed above)
- Supply Cushion: 120,000 AF expected annual supply and storage three times demand at full build out
- More Storage: 100,000 AF expected annual supply and storage four times demand at full build out
- Supply Cushion/More Storage: 120,000 AF expected annual supply and storage four times demand at full build out
The “song remains the same.”
The structure of the probability of water shortages is the same. Once shortages emerge, they will become regular within a decade. More storage in the project will shift out the risk of water shortages a few years. A 20% supply cushion can shift out the risk of water shortages a decade.
Like the risk of water shortages, the expected size of water shortages shows the same structure. The scenario defines the timing of the decade in the transition to significant water shortages, not its existence. Again, a supply cushion is more of a driver than additional water storage in pushing out when water shortages occur. More storage does shift out the time profile of shortages, but not in the long-run.
The profile of expected carryover storage tells the history and future of the parable’s water project. More storage helps build up the “bank account” of stored water before demand reaches full build out (compare More Storage to Base Case Scenarios and Supply Cushion to Supply Cushion/More Storage scenarios). In all scenarios, expected carryover storage falls rapidly as the bank account of stored water built in early years is drawn down permanently. The 20% supply cushion pushes out for more years the demise of the system than simply more storage.
The Times Are A Changing
A water system can withstand a few decades of gridlock, but ultimately gridlock must yield to action. In our water parable, a project planned in the mid-20th century can withstand gridlock over its expansion until build out and beyond. The bank account of stored water in early years provides a valuable asset to draw down as our polity struggles over the next steps. Once water storage starts its secular decline, listen to this indicator species (the “canary in the mines” so to speak and note when they start dropping). We can tolerate perhaps less than another decade of gridlock. If gridlock were to continue, thereafter water systems run the risk of becoming dysfunctional.
This parable, of course, involves expected outcomes and, as such, discussed long-term trends. Just as Mother Nature can be beneficent (by providing deluges of above average water supplies), she can also be a harsh mistress (think drought). The dry conditions throughout the west have placed additional stress on water systems already facing long-term stresses. Will necessity become the Mother of invention?
Will gridlock finally end because we can no longer afford it?
Postscript:
For those who find the prospect of system failure unfathomable, consider how the world looked in the 1970s. US/USSR superpower competition was entrenched for 30 years after World War II, the US was in retreat in southeast Asia. Berlin had a wall separating West and East Germany. Well, within just over a decade later, the Berlin Wall was down, the two Germanys united and, shortly thereafter, the USSR dissolved. Who would have thought it possible in the 1970s? It turns at there were a few at the RAND Corporation, but that is another story.
Written by Rodney T. Smith, Ph.D.


You must be logged in to post a comment.